Fluo has a stress test which computes the number of unique integers through the process of building a bitwise trie. Multiple collections of randomly generated integers are provided as input. The test suite includes a simple map reduce job that can read the same data fed to Fluo and compute the number of unique integers. The correctness of Fluo can be verified by checking the result in Fluo against the map reduce job. The test is intended to exercise Fluo at scale and complements the unit and integration test. One of our goals before releasing beta is to run this test on clusters for long periods of time. This post records the experience of running the stress test overnight on a cluster for the first time.
For this test run, initially ~1 billion random integers were generated and loaded into Fluo via map reduce. After that ~100K random integers were repeatedly loaded 120 times, sleeping 2 minutes between loads. After everything finished, the test was a success. The number of unique integers computed independently by MapReduce matched the number computed by Fluo. Below is the output of the stress test count from Fluo.
 $ java -cp $STRESS_JAR io.fluo.stress.trie.Print $FLUO_PROPS
 Total at root : 1011489250
 Nodes Scanned : 59605
Below are a few lines of output selected from the map reduce job.
 Map input records=1011999273
 io.fluo.stress.trie.Unique$Stats
    UNIQUE=1011489250
This output shows that 1,011,999,273 random integers (between 0 and 1012-1) were given to Fluo and map reduce. Both computations reported 1,011,489,250 unique integers.
Graphite Plots
Before running the overnight test, a quick test with only a few iterations was run against an empty table. This initial test went well and had no problems keeping up. Based on that quick test, the decision was made load 100K random integers into Fluo every two minutes for 120 iterations. However a big difference between the quick test and the long running test, was that the long running test did not start with an empty table. What worked well for an empty table did not work well for a table with a billion initial entries. The long running test was kicked off in the evening, giving EC2 something to do in the wee hours.
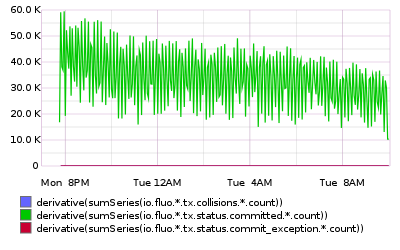
In the morning the long running test was still running, but had fallen behind. The image below shows transaction committed per minute and covers a 15 hour period. Unfortunately this image does not include the load transactions, there was a problem getting that reported to Graphite. So only Observer transactions are shown in the plot.
The image below shows notifications queued and covers a 15 hour period.
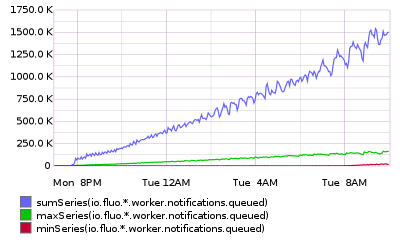
Upon seeing that the test was falling behind, fiddling with it was unavoidable. The table was configured to use bloom filters and a compaction forced, with the hope that this would lead to less file accesses. This caused performance to drop for some reason. Since that did not work, different bloom filter setting were set and another round of compactions forced. The new settings caused tablet servers to start dying with out of memory errors. The Fluo workers continued to limp along using a subset of tablet servers. The fiddling and futzing was declared a failure, bloom filter settings reverted, another round of compactions issued, and tservers restarted. Around the time the fiddling ended, so did the map reduce jobs that were loading new data. It was very satisfying that the counts came out correct after all of this disruptive activity.
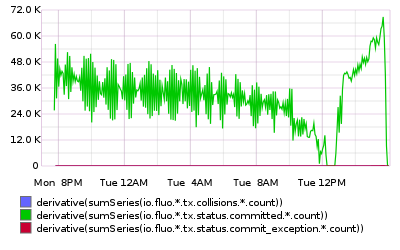
The plots below cover a 21 hour period and overlap in the 1st 15 hours with the plots above. The drops in performance are due to the previously mentioned shenanigans. The dramatic recovery is due to load transactions finishing and compacting away bloom filters.
The plot below shows transactions committed per minute.
The image below shows notifications queued.
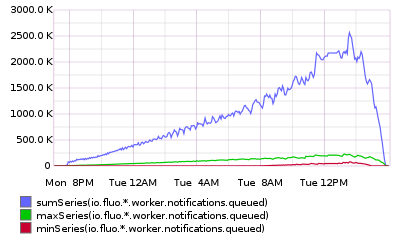
Something mysterious in the plot above is the difference between min and max queue sizes. To investigate, Graphite was used to plot each workers queue size over time. This plot is shown below. Its hard to see from the plot, but 10 workers start falling behind almost immediately and 7 did not. No idea what happened here.
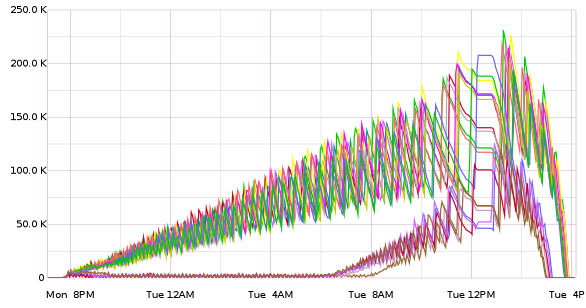
Test Environment
The test was run on 20 m1.large EC2 nodes using the script at the end of this
README. The parameters in the script were set as follows, the for loop
was changed to {1..120}, and the sleep time was set to 120.
MAX=$((10**12))
SPLITS=68
MAPS=17
REDUCES=17
GEN_INIT=$((10**9))
GEN_INCR=$((10**5))
The following was used to run the test :
- Custom balancer
- accumulo-site.xml
- fluo.properties
- Table settings
- Fluo from commit acf1ea7d8d6bc74eef7e311008e5e8fc0fd94d30
- Accumulo 1.6.1
- Hadoop 2.6.0
- Centos 6.5
Conclusion
We are very happy the counts came out correct especially since some tablet servers died (which was unplanned). In a later test, we can hopefully kill tablet servers, Fluo workers, and datanodes.
Looking at the numbers leads to the question: was the performance good? At this point that is unclear. Need to get a sense of what the theoretical maximum rate would be based on basic performance characteristics of nodes. That mathematical model does not exist at the moment.
The particular EC2 nodes used in this experiment are not very speedy. A single high end workstation can match the performance of these 20 nodes, however scaling issue will never be seen on a single node. The m1.large nodes were used because they were cheap. Many scaling issue were found using these nodes. After working out bugs on the cheaper nodes, we may run experiments using more expensive, high performance EC2 nodes. However this will depend on #356 which should make that process easier. The current 20 node m1.large setup was partially manually setup.
Further experiments could be done adjusting various Accumulo and Fluo settings, like number of threads. Also, it will be interesting to see what impact implementing issues like #12 will have.
View all posts in the news archive